When students face problems in measurement that ask them to make comparisons, many students aren’t sure what to pay a attention to or how to create a visual representation.
Many times teachers use very abstract explanations like “what is the difference between 18 and 10?” Or they give too much away by saying things like “just subtract 10 from 18.” Even if we do pull out a ruler, rarely do we show the comparison between the two measurements at the same time. In order to better help students understand this concept, we must make it more visual for them and teach them how to write a visual representation of the comparison model.
One of our second grade teachers told me her students were struggling with this last week and I mentioned that a great tool to show the difference between the numbers is a number line. A part-part-whole diagram is also a great way (and rarely used) for students to see the relationship between the numbers.

I just happened to have a jar of different types and styles of Washi tape in my room and I suggested that she use these as a visual representation of bar modeling to show the difference between the two. This way students could actually measure the lengths and compare them side-by-side. And who doesn’t like Washi tape?
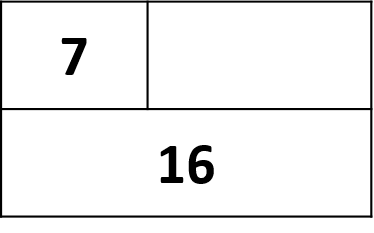
She used this model with students in small group. When she was working with one particular student on a comparison between 15 and 32, she gave him the model to the right. He told her he could add 7 to get to 22 and then 10 more to 32, so the difference was 17. I wonder if writing the numbers he added (like on an empty number line) might be a great way to reinforce making friendly numbers at the same time with other students?
In this particular example, she did not have the student measure the two lengths. Is there any value in that? Is that the next step in scaffolding his learning?

